On January 21, 2020 the first confirmed case of SARS-CoV-2 (COVID-19) was reported in the state of Washington.
Documented in the map below are the state level public health interventions implemented by state goverments to limit the transmission of COVID.
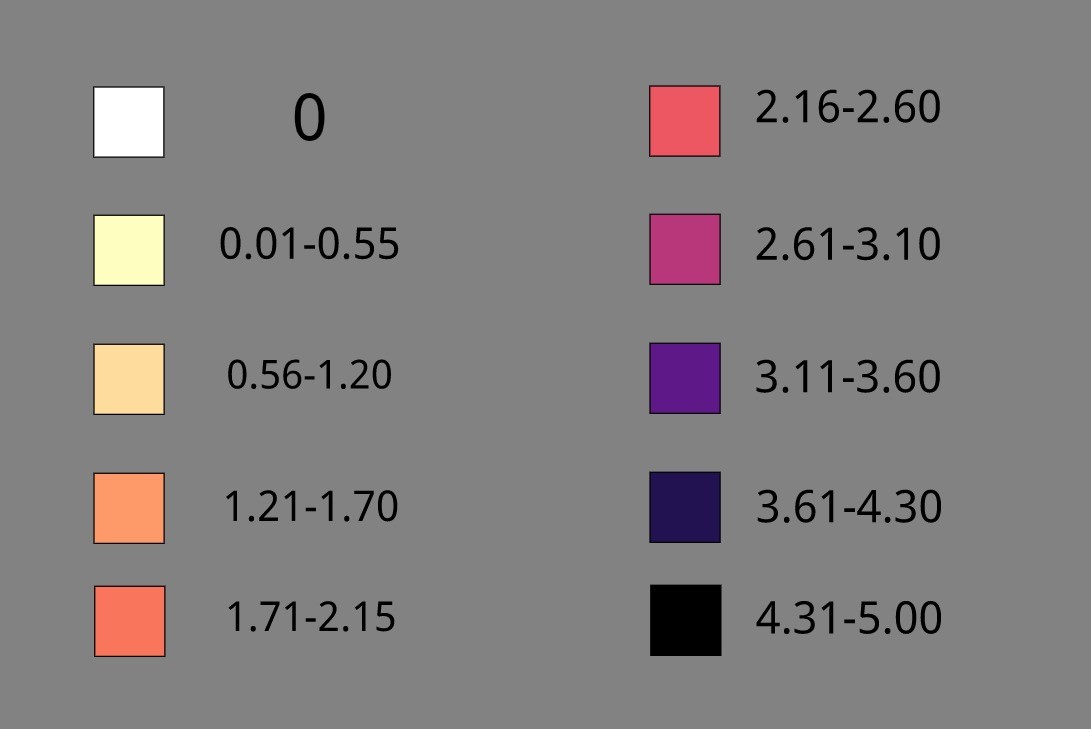
Each state was given a score based on the strength and amount of interventions currently in place.
The higher a score, the darker in color a state will appear, representing stringent interventions in place at that point in time. The green circles represent the number of new daily COVID cases per 500,000 people in each state.
The map plays through time from March to October so state actions in response to the current pandemic can be visualized. Click on a state to learn more as the map plays or go to our graphs page to explore different interventions through time!

P H I G H T C O V I D
Public Health Interventions aGainst Human-to-Human Transmission (PHIGHT) of COVID-19


